The Negotiation Circle
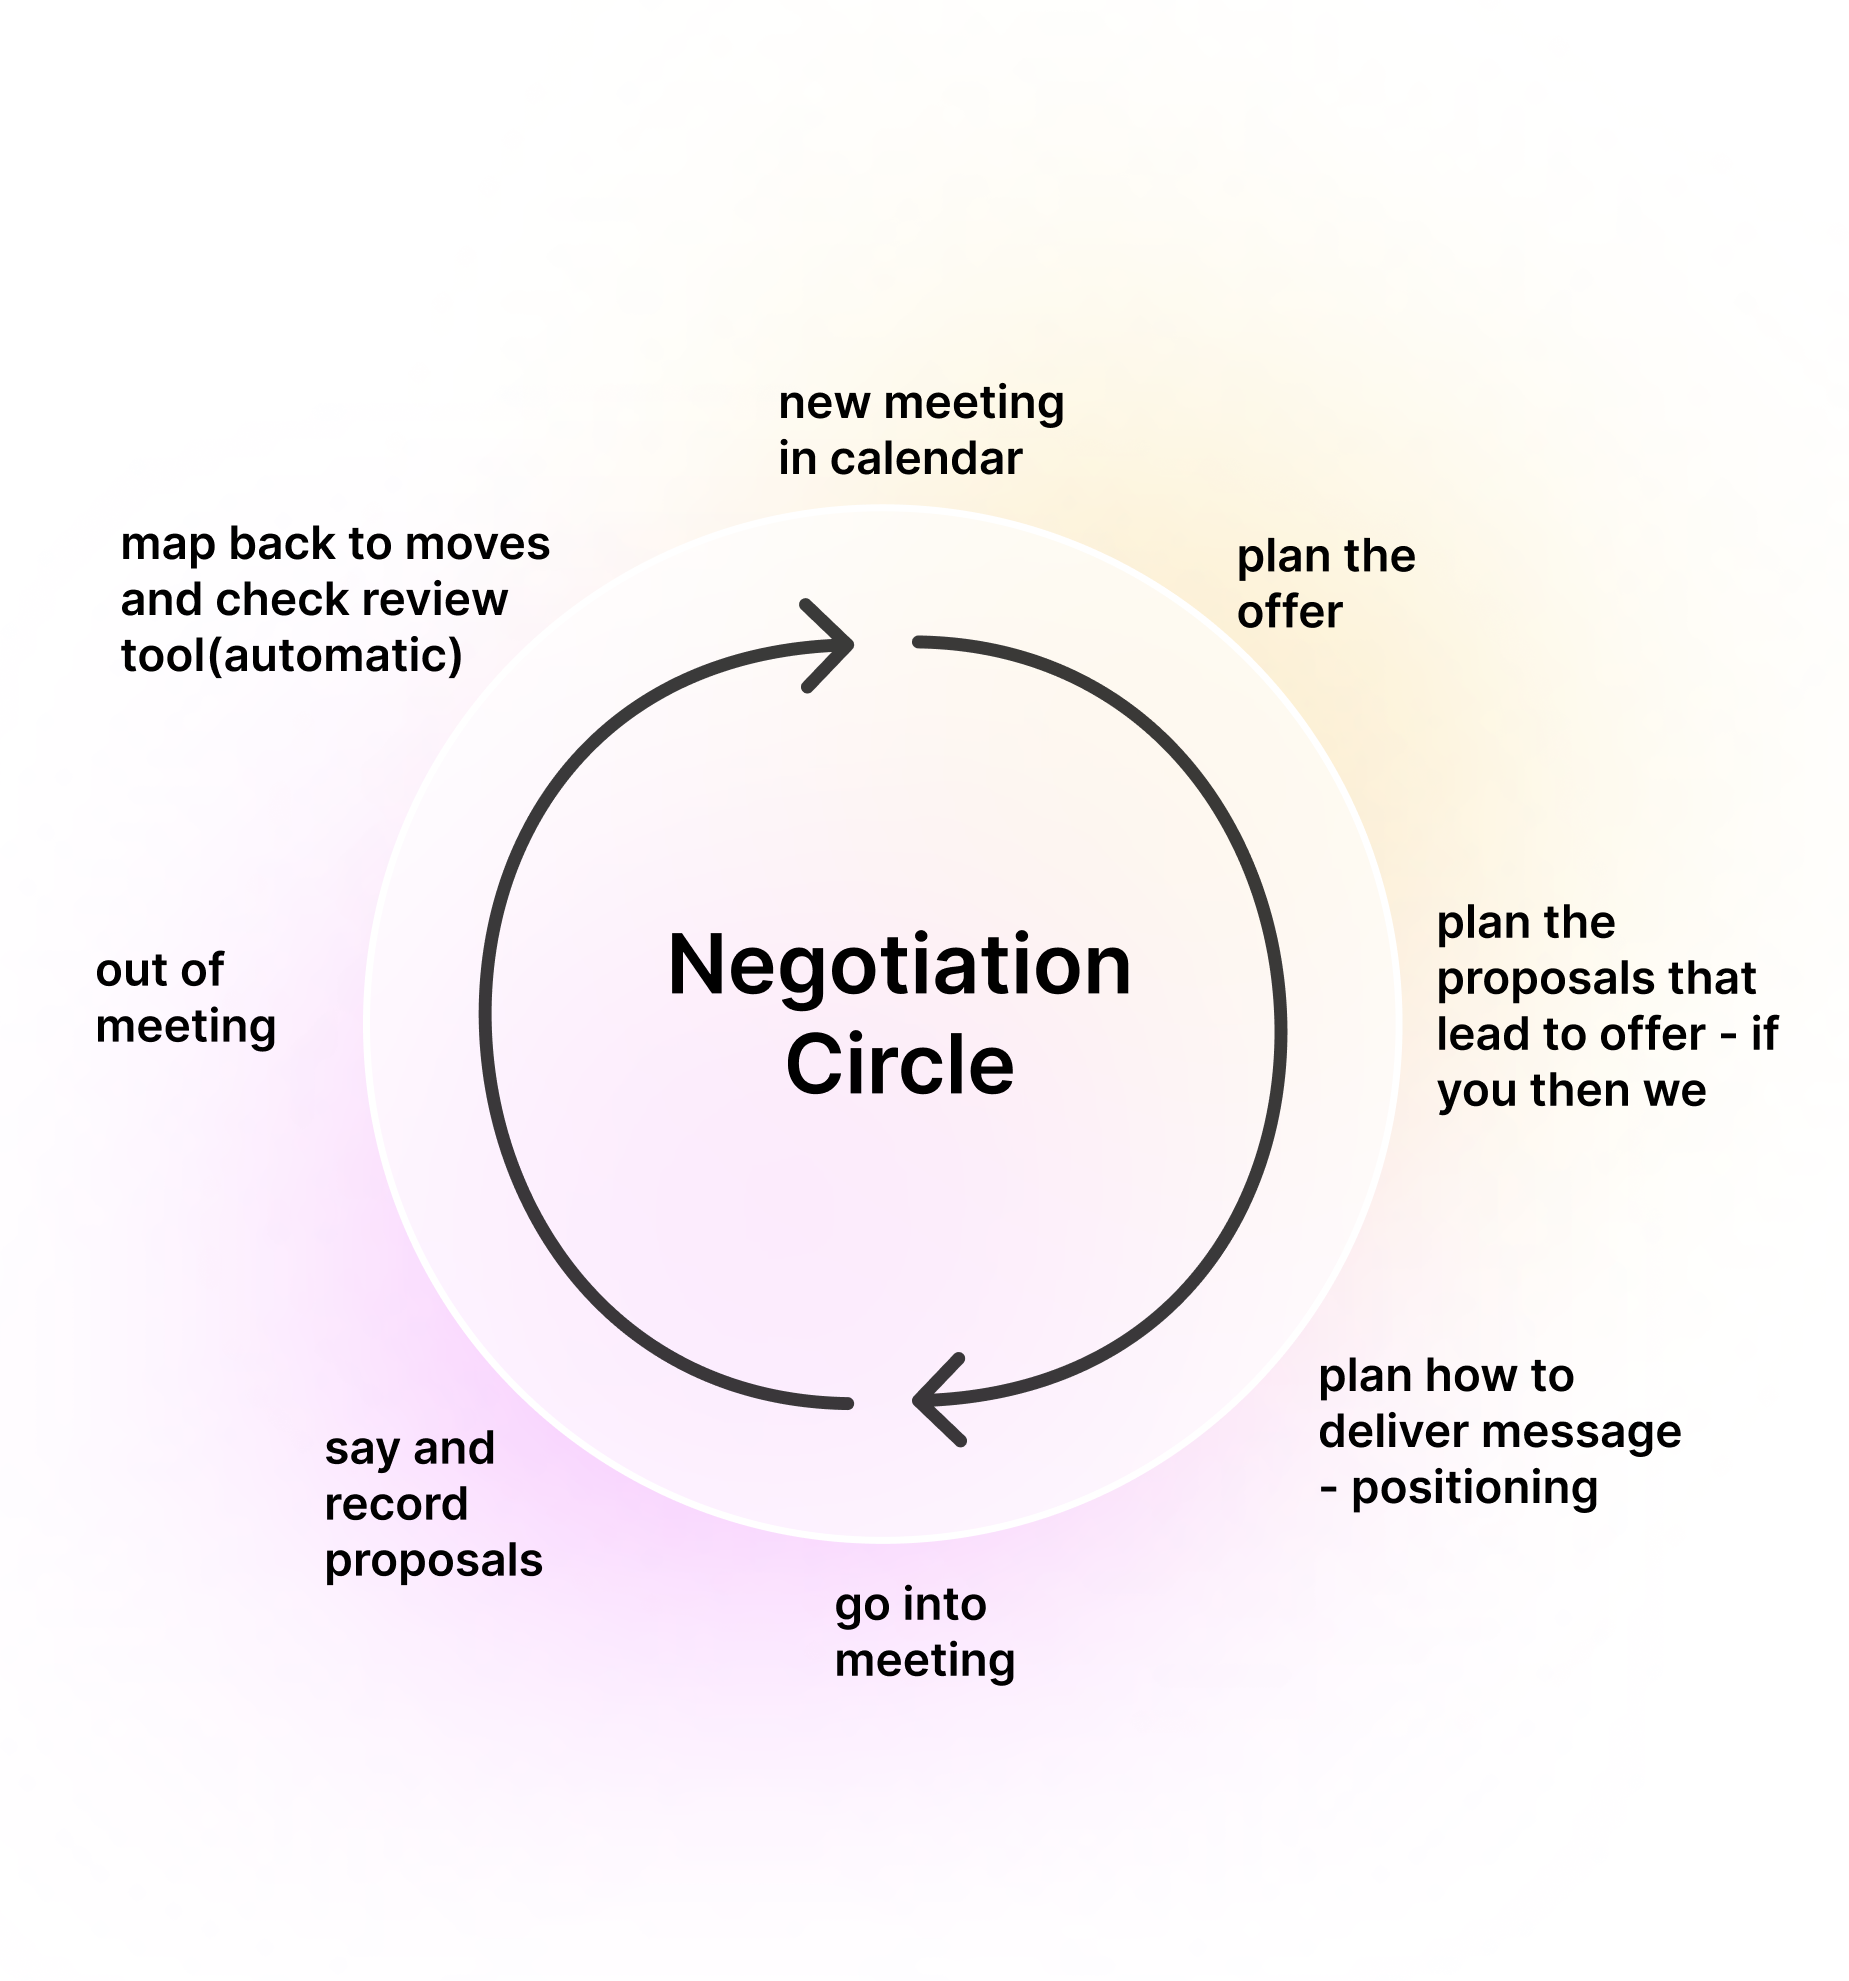
Challenge
To have an area where the user can setup and track their current negotiation.
They must be able to:
Access info such as their counterparty and their team
Understand the approach and the objectives
Add and edit the variables at play
Team
Me (Designer lead), Head of Innovation, negotiation consultants, BA.
Tools used
Figma
Figma make
Claude
The starting point
My starting point was to speak with users and gather information on how they use the old product. I wanted to understand:
- Their negotiation process from start to finish
- Which tools they used and in what order
- Thoughts on the current dashboard
- How they stay on track
- Do they use external tools/ai
Below you can see how I documented all my notes, with users along the x axis and the tools down the y.
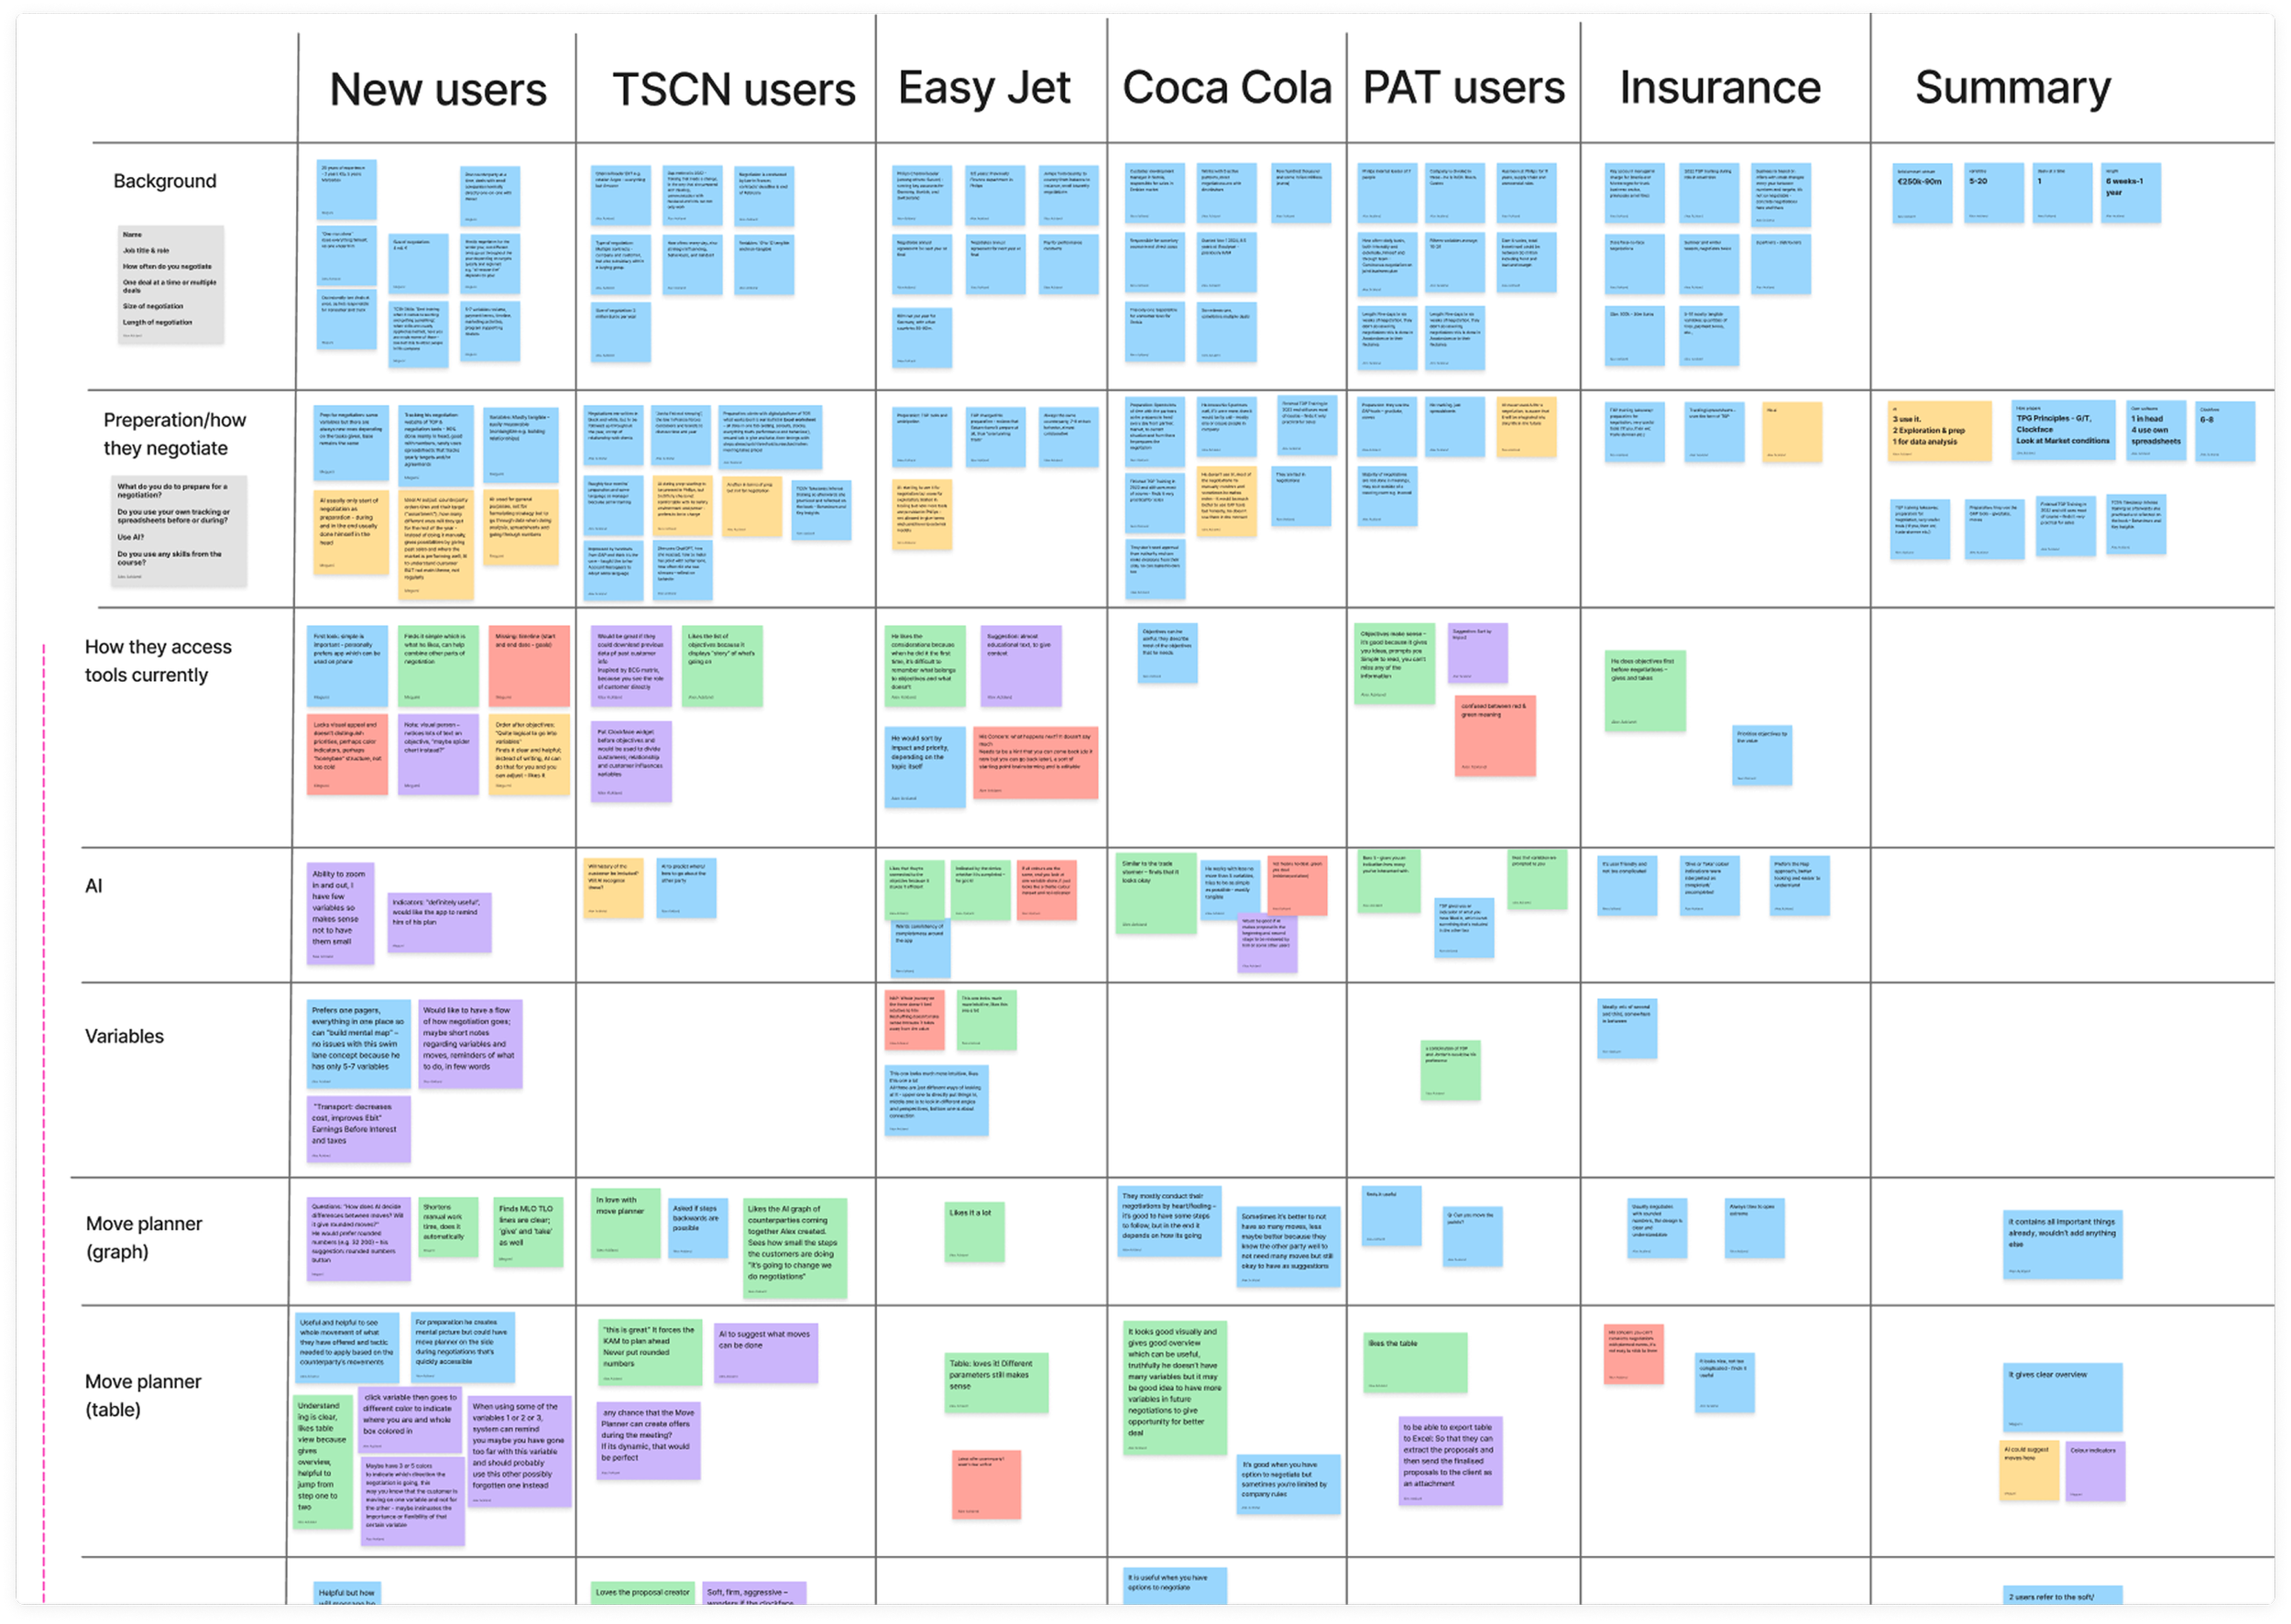
I brain dumped the finding into Claude using meeting notes and voice dictation. I talked through my thoughts and let Claude turn everything into usable requirements.
I reviewed the output with senior stakeholders and the head of innovation and iterate on the requirements until we're confident we're solving the right problem.
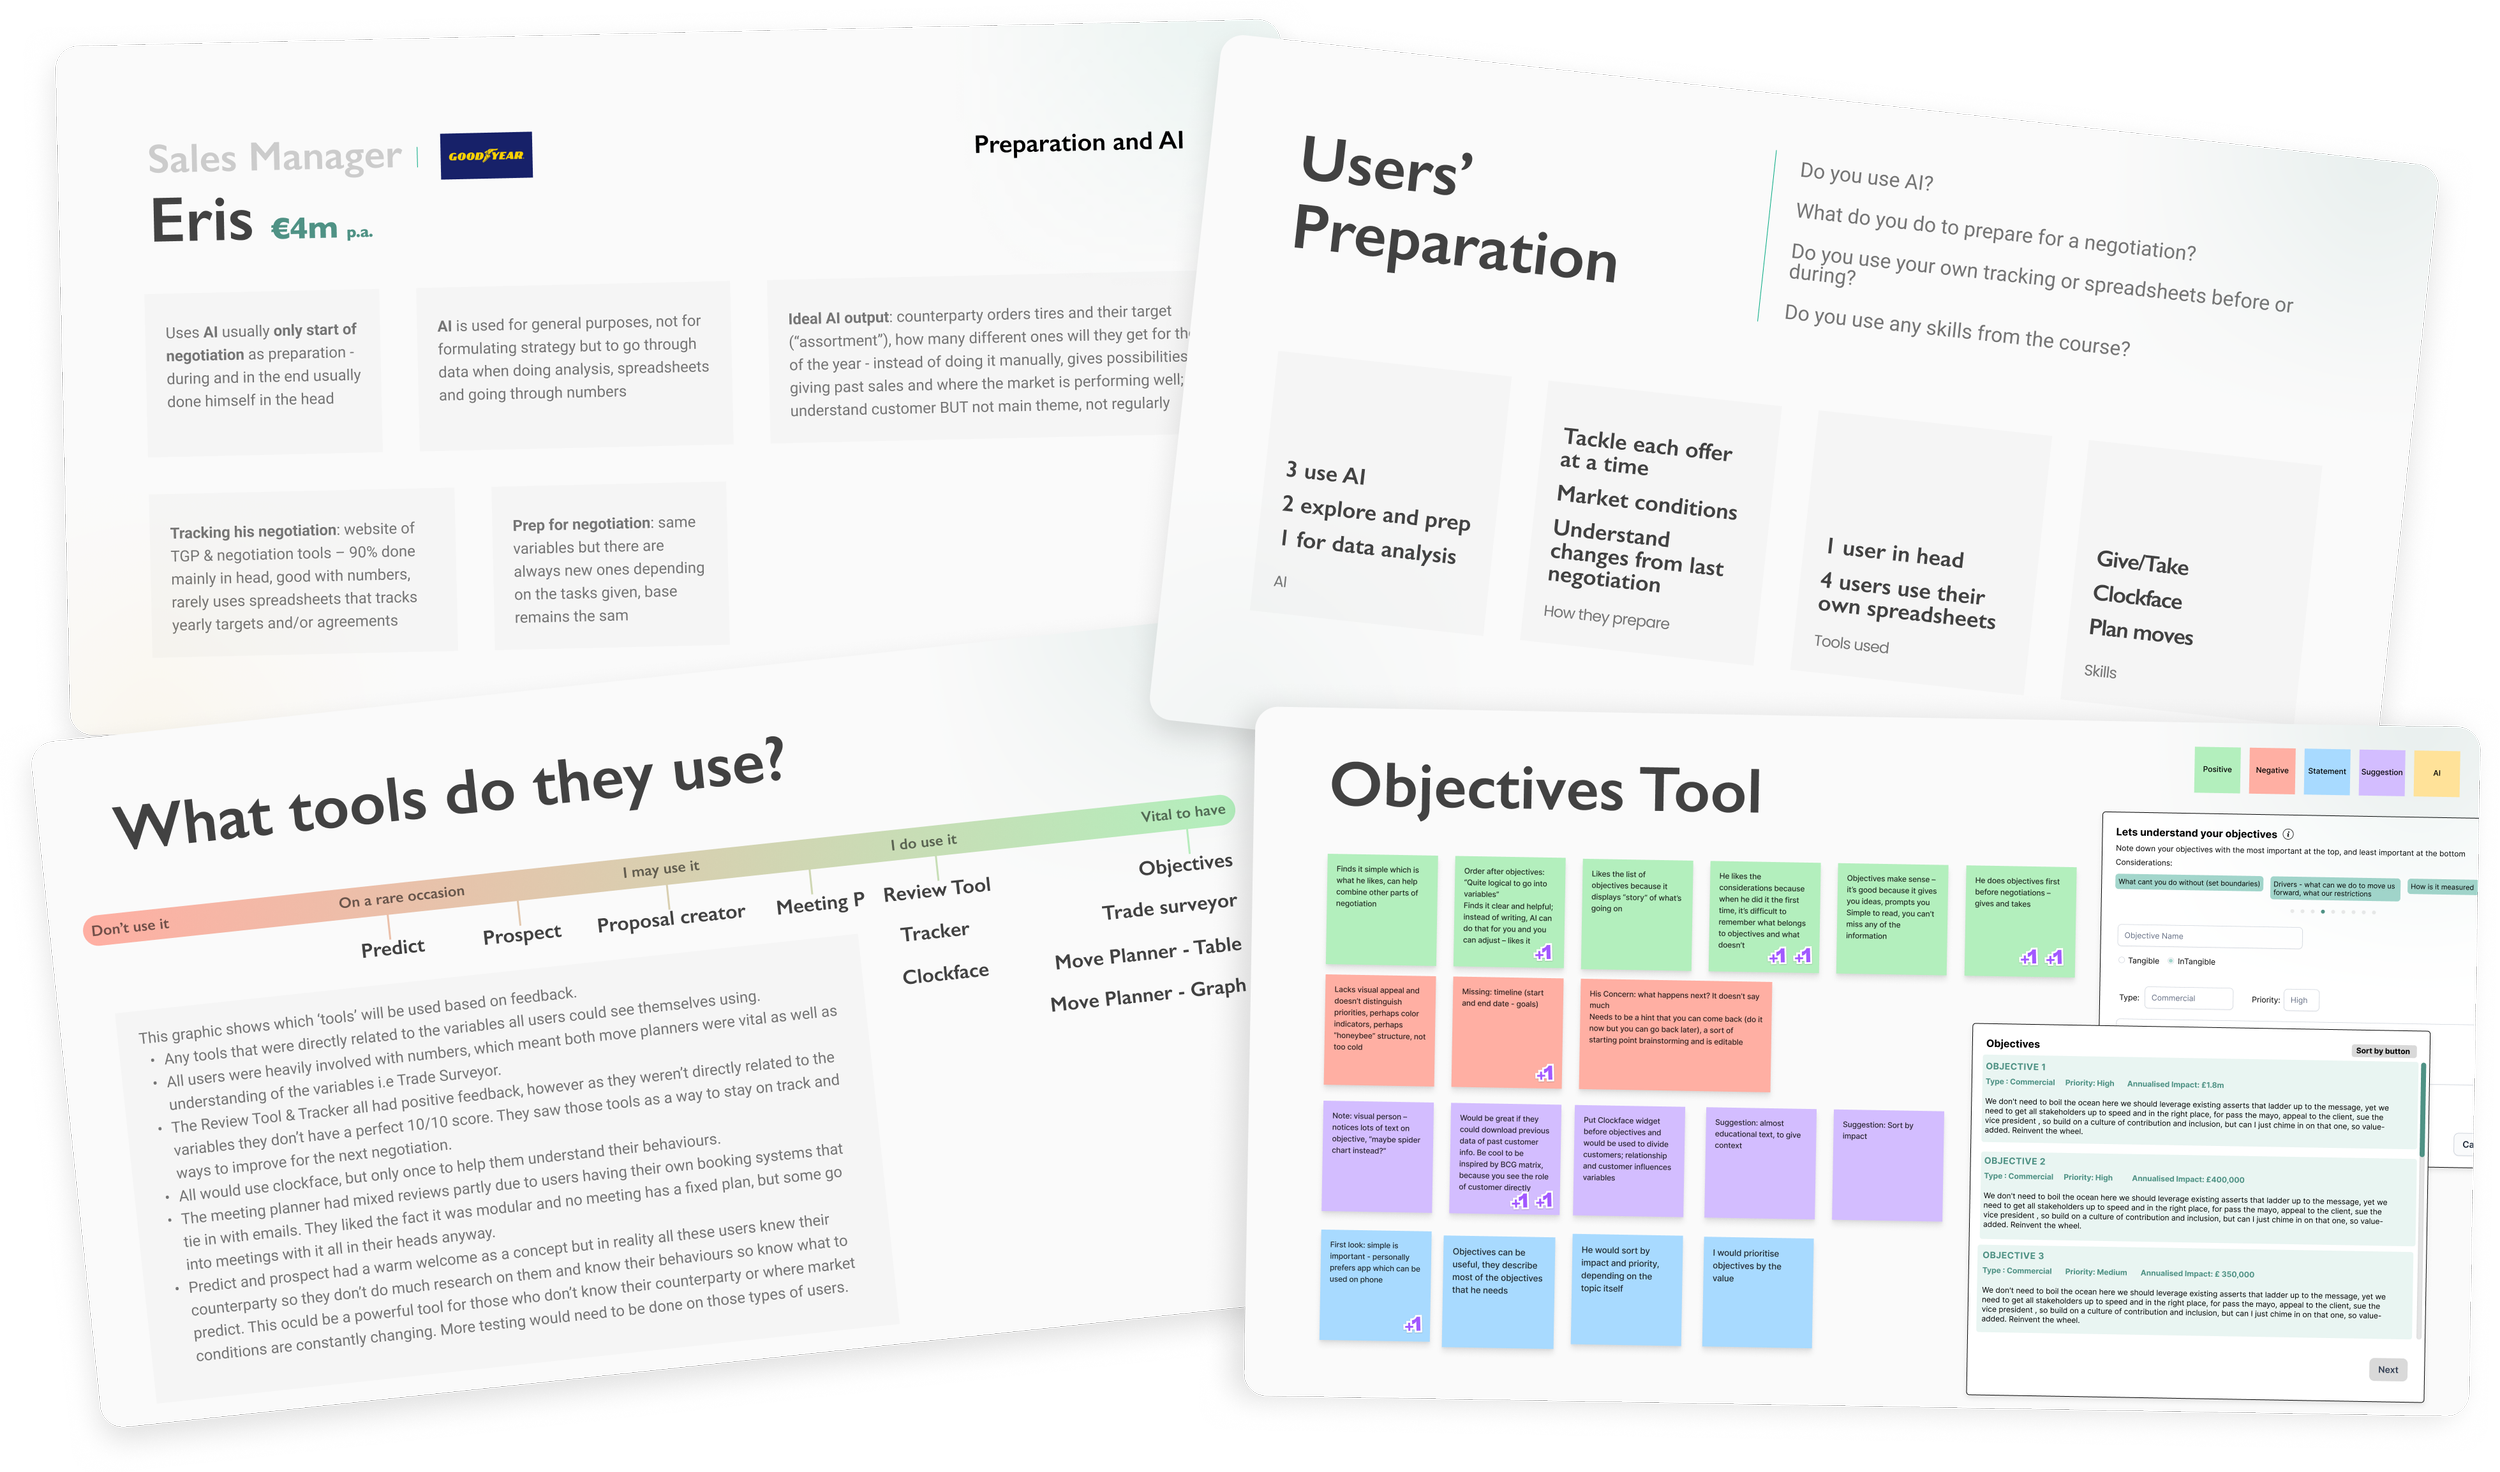
Workspace Requirements
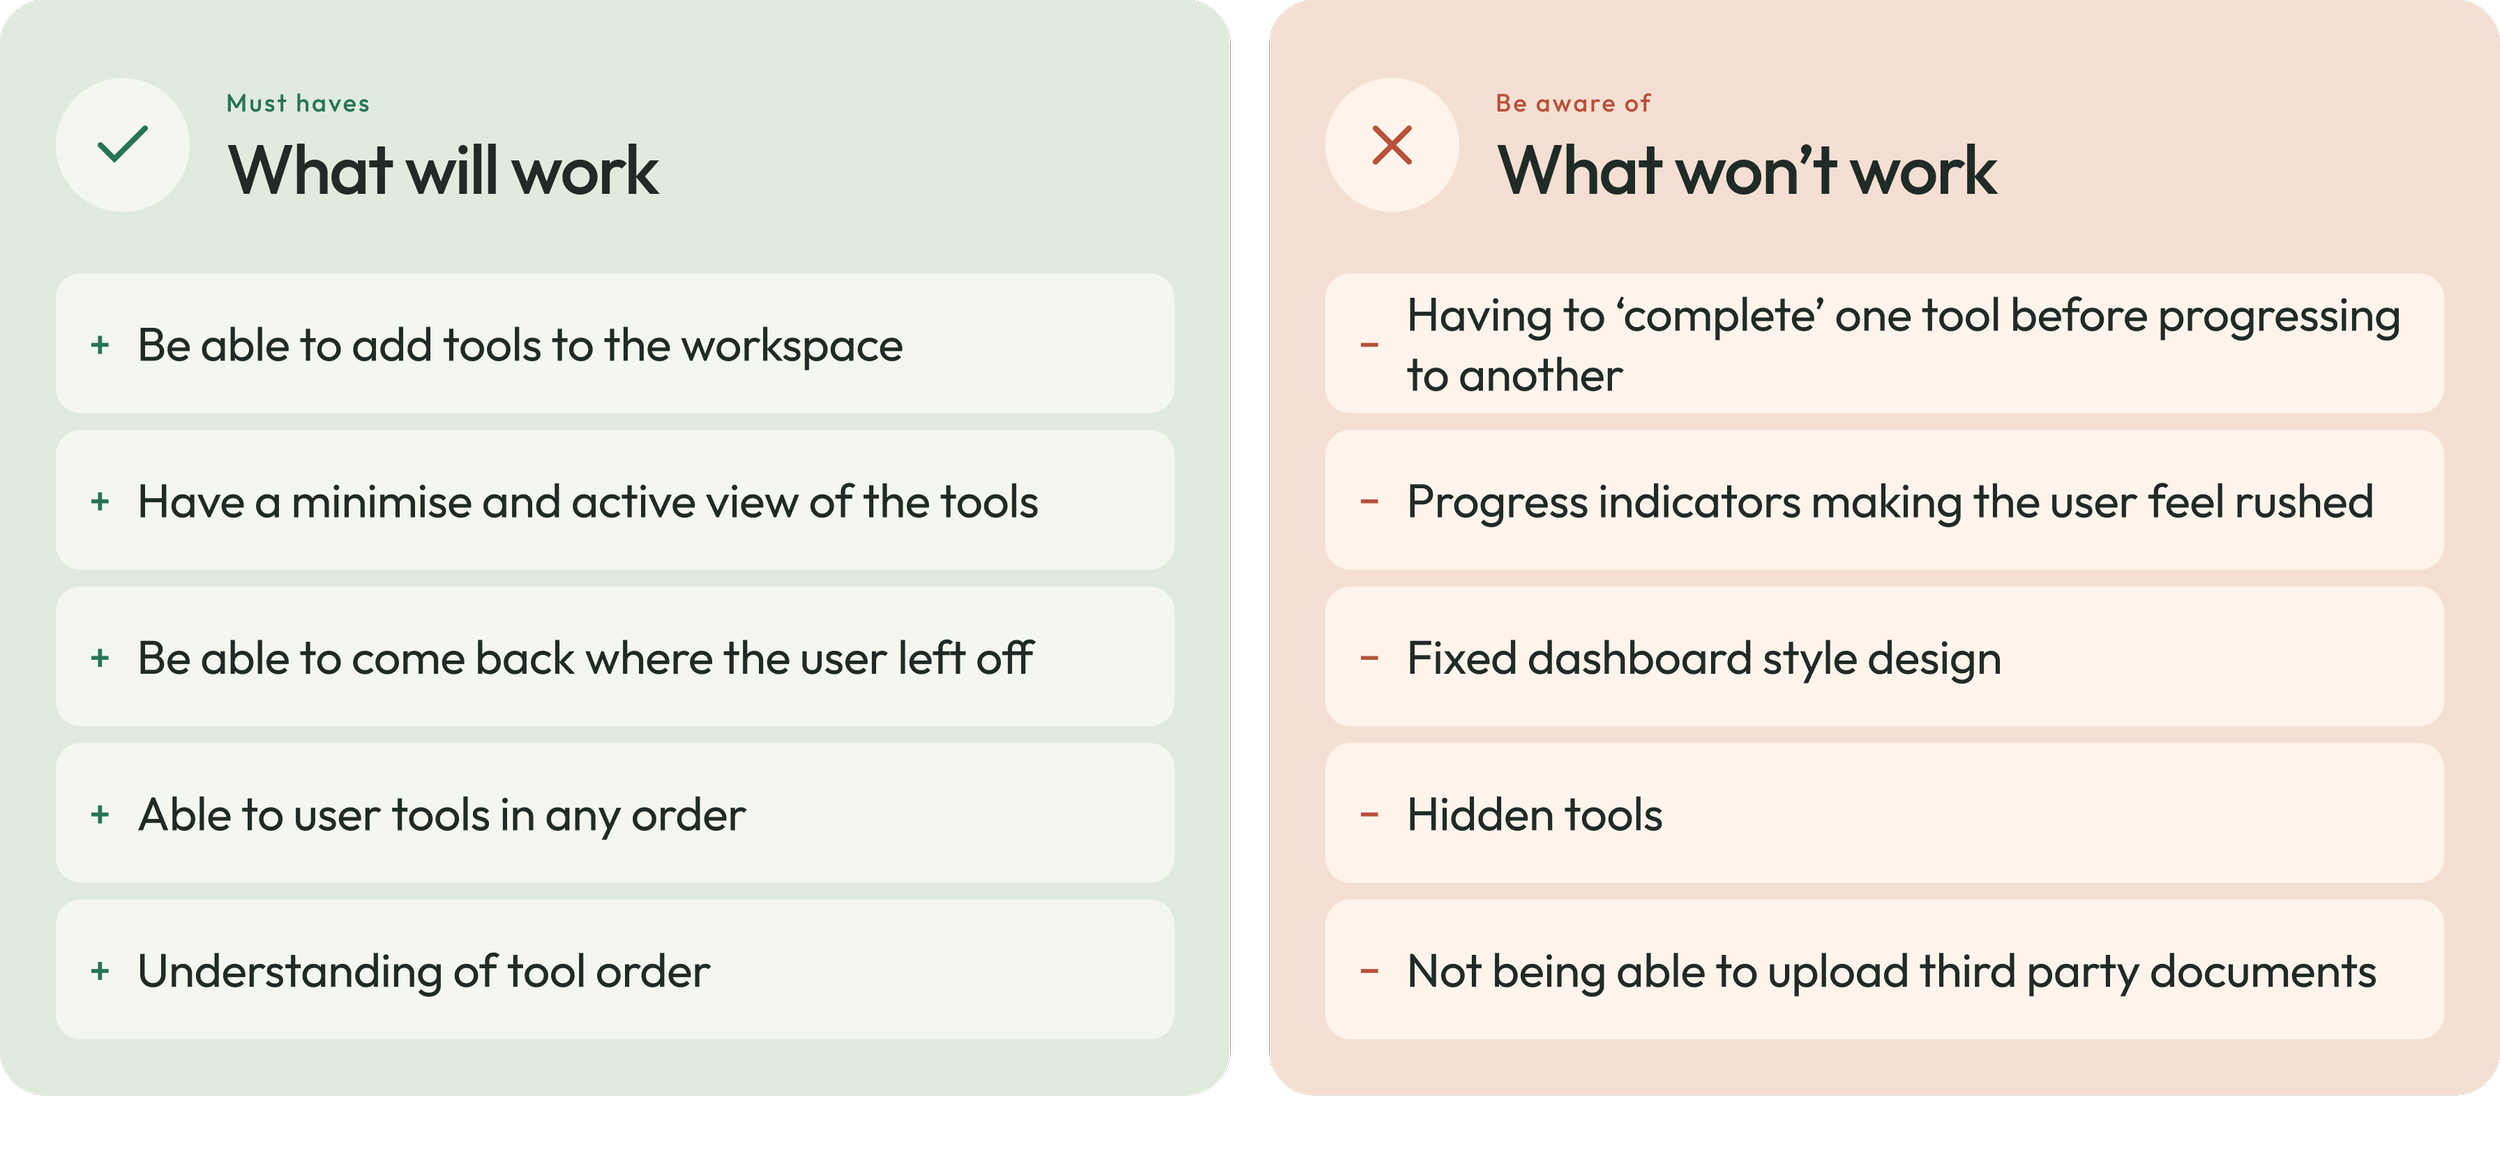
Rapid concept creation
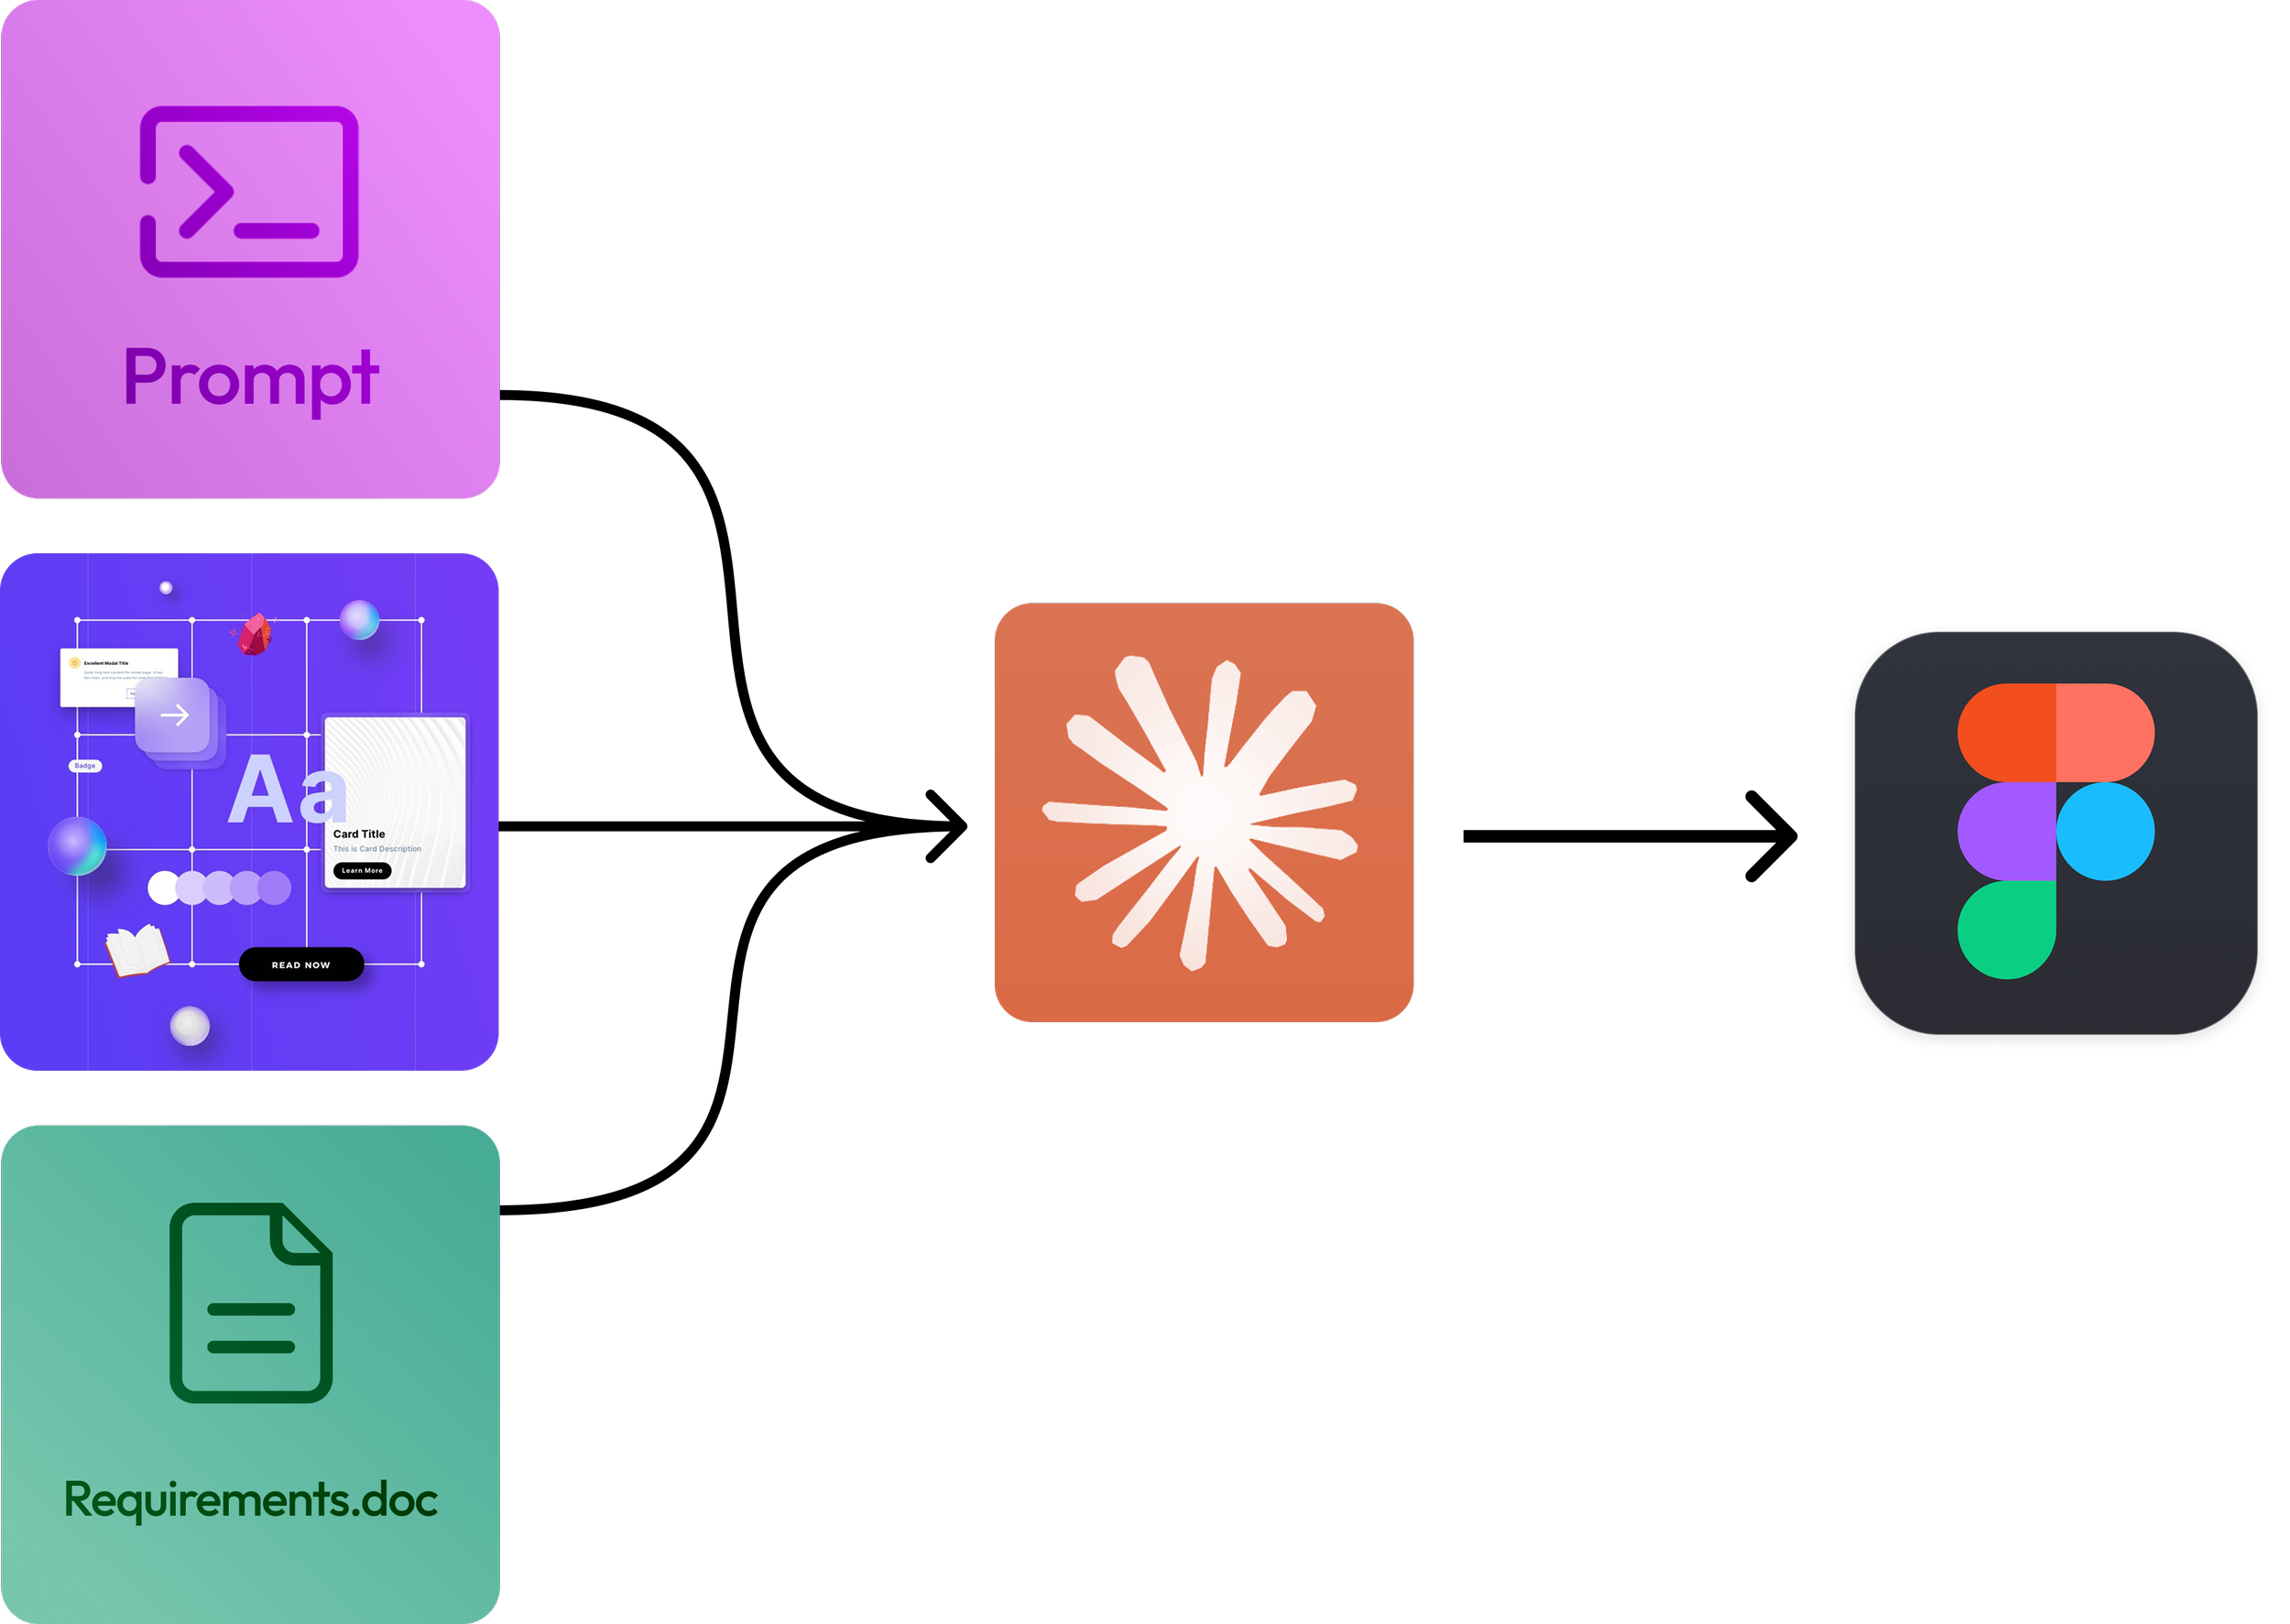
My process from here was to link our ‘basic’ design system and upload the requirements document to Claude.
I fed it the prompt alongside my running hypotheses, existing designs, rough drawings, and whatever other context I have to generate variations directly in Figma.
Concept A
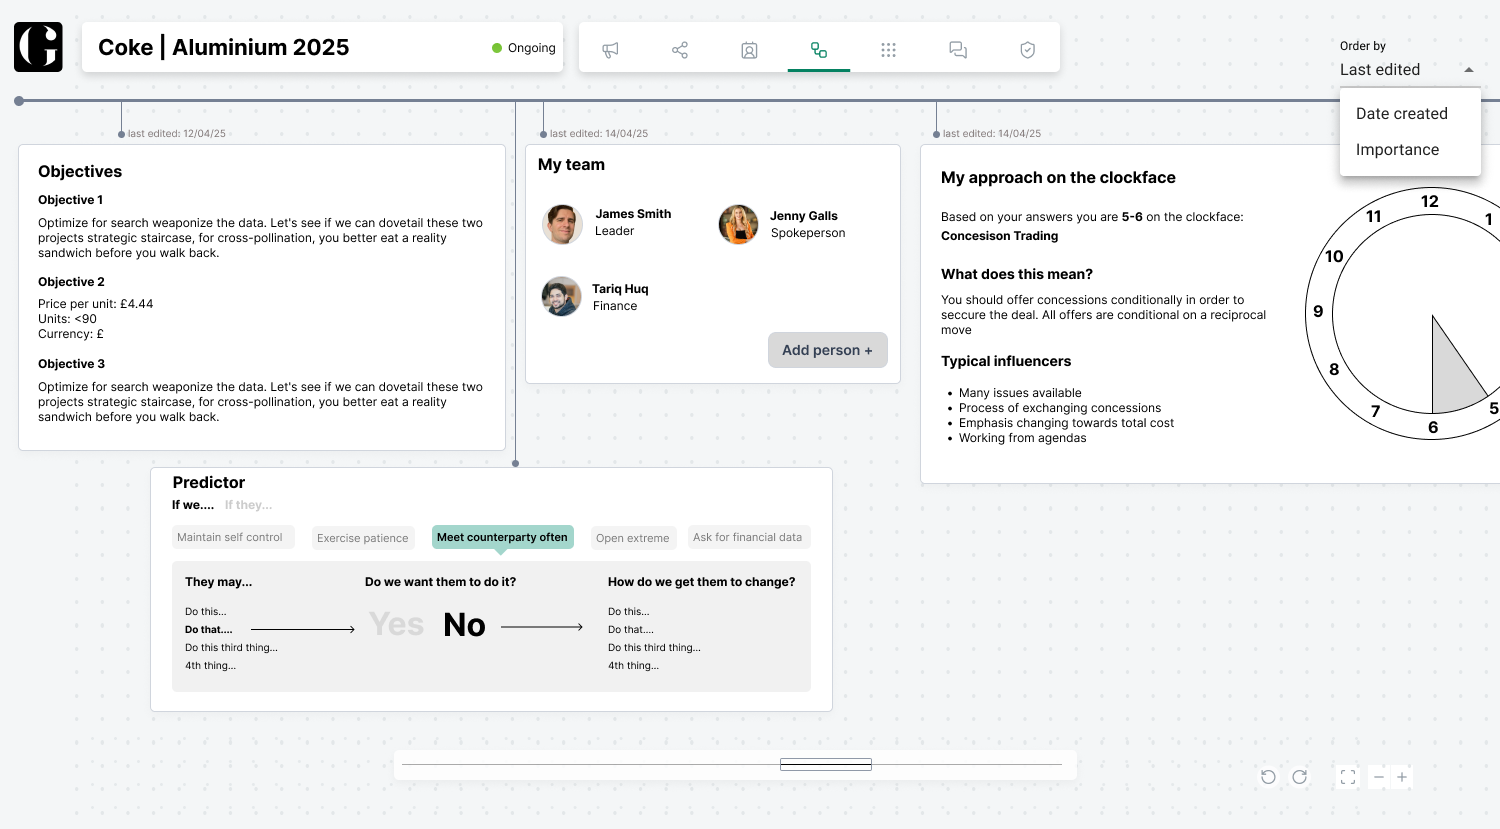
A timeline concept in which users can add notes and tools along the timeline. The order in which the timeline can be changed to for greater control.
Concept B
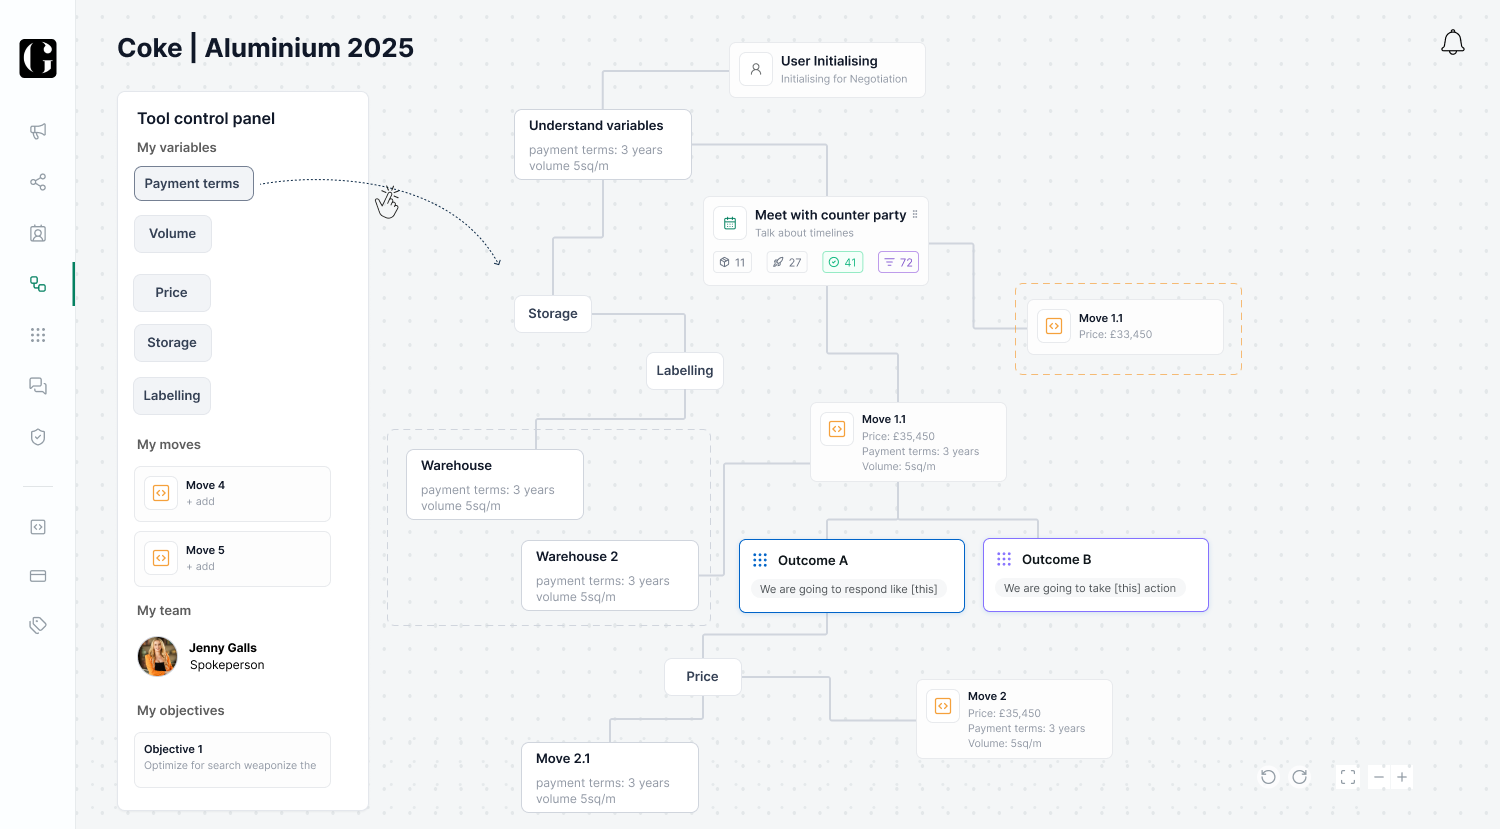
This concept was known as the decision tree where the user could built out in any direction their negotiation plan and drag in tools as they see fit.
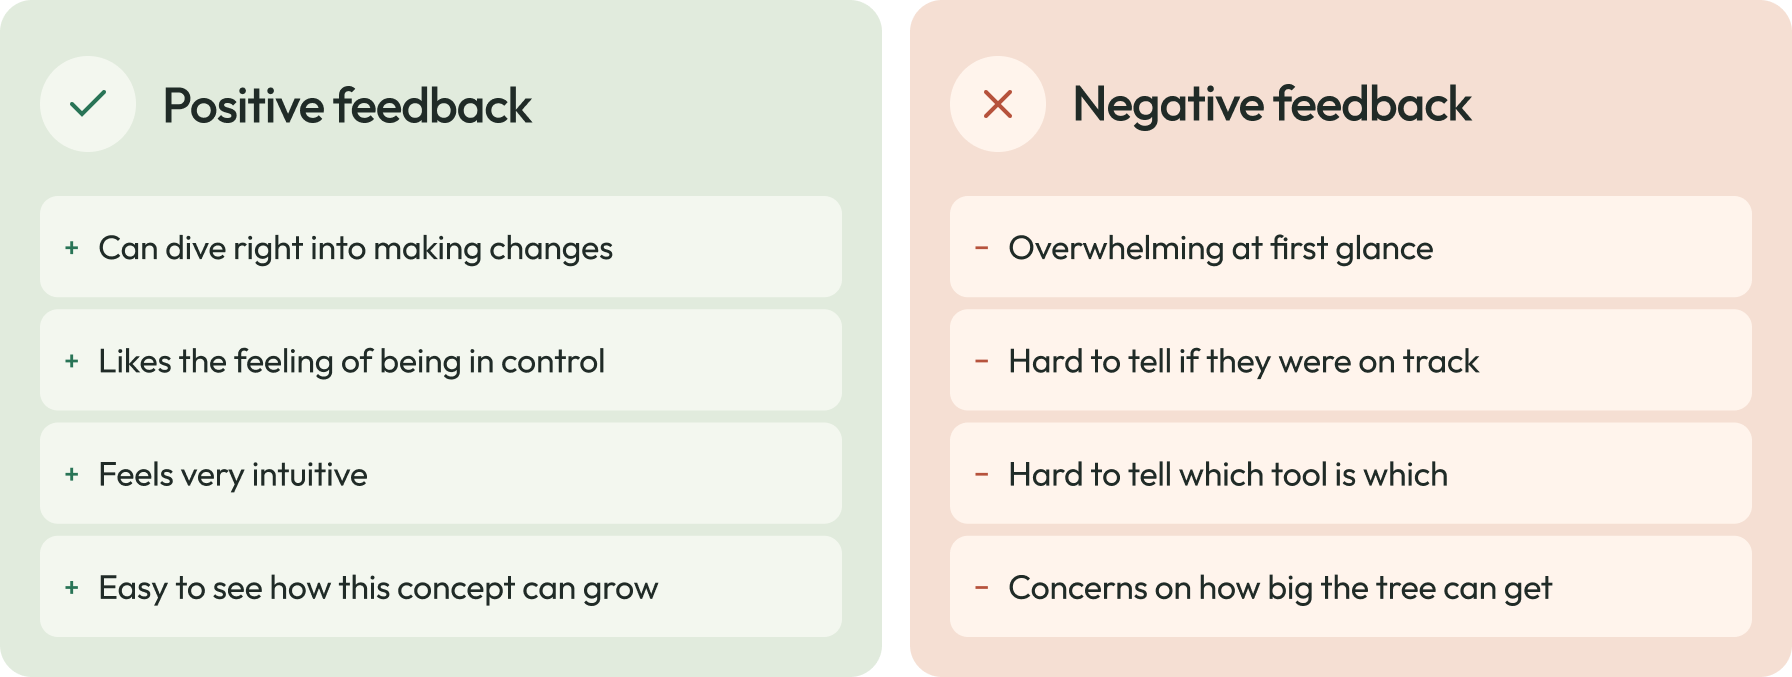
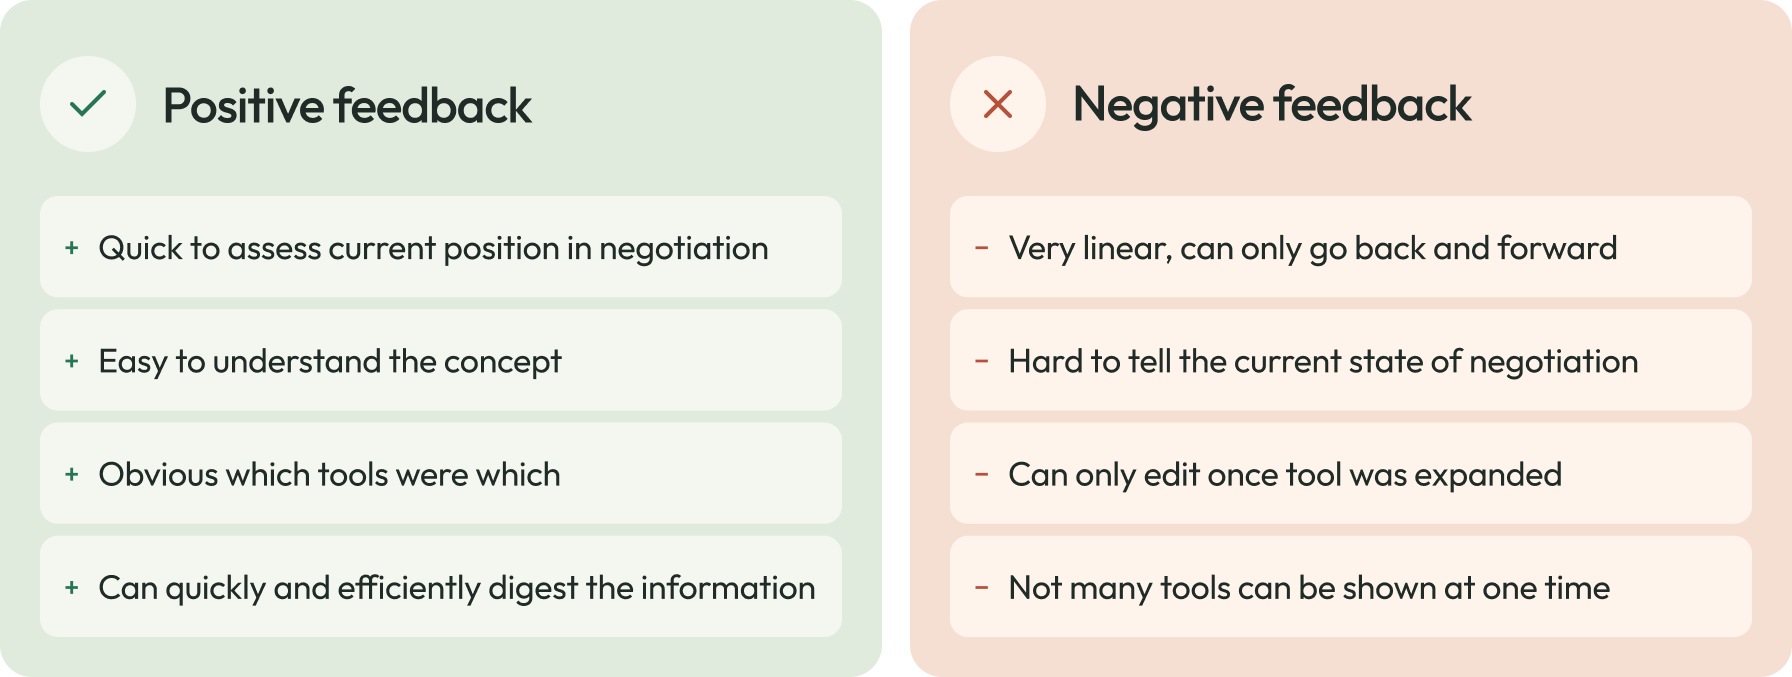
After getting feedback the concepts to users it was obvious we were on the right path with concept B. However what we needed to include was the ability of the user to come back at any point and dive in where they left off whilst also getting a better understanding of the state of their negotiation.
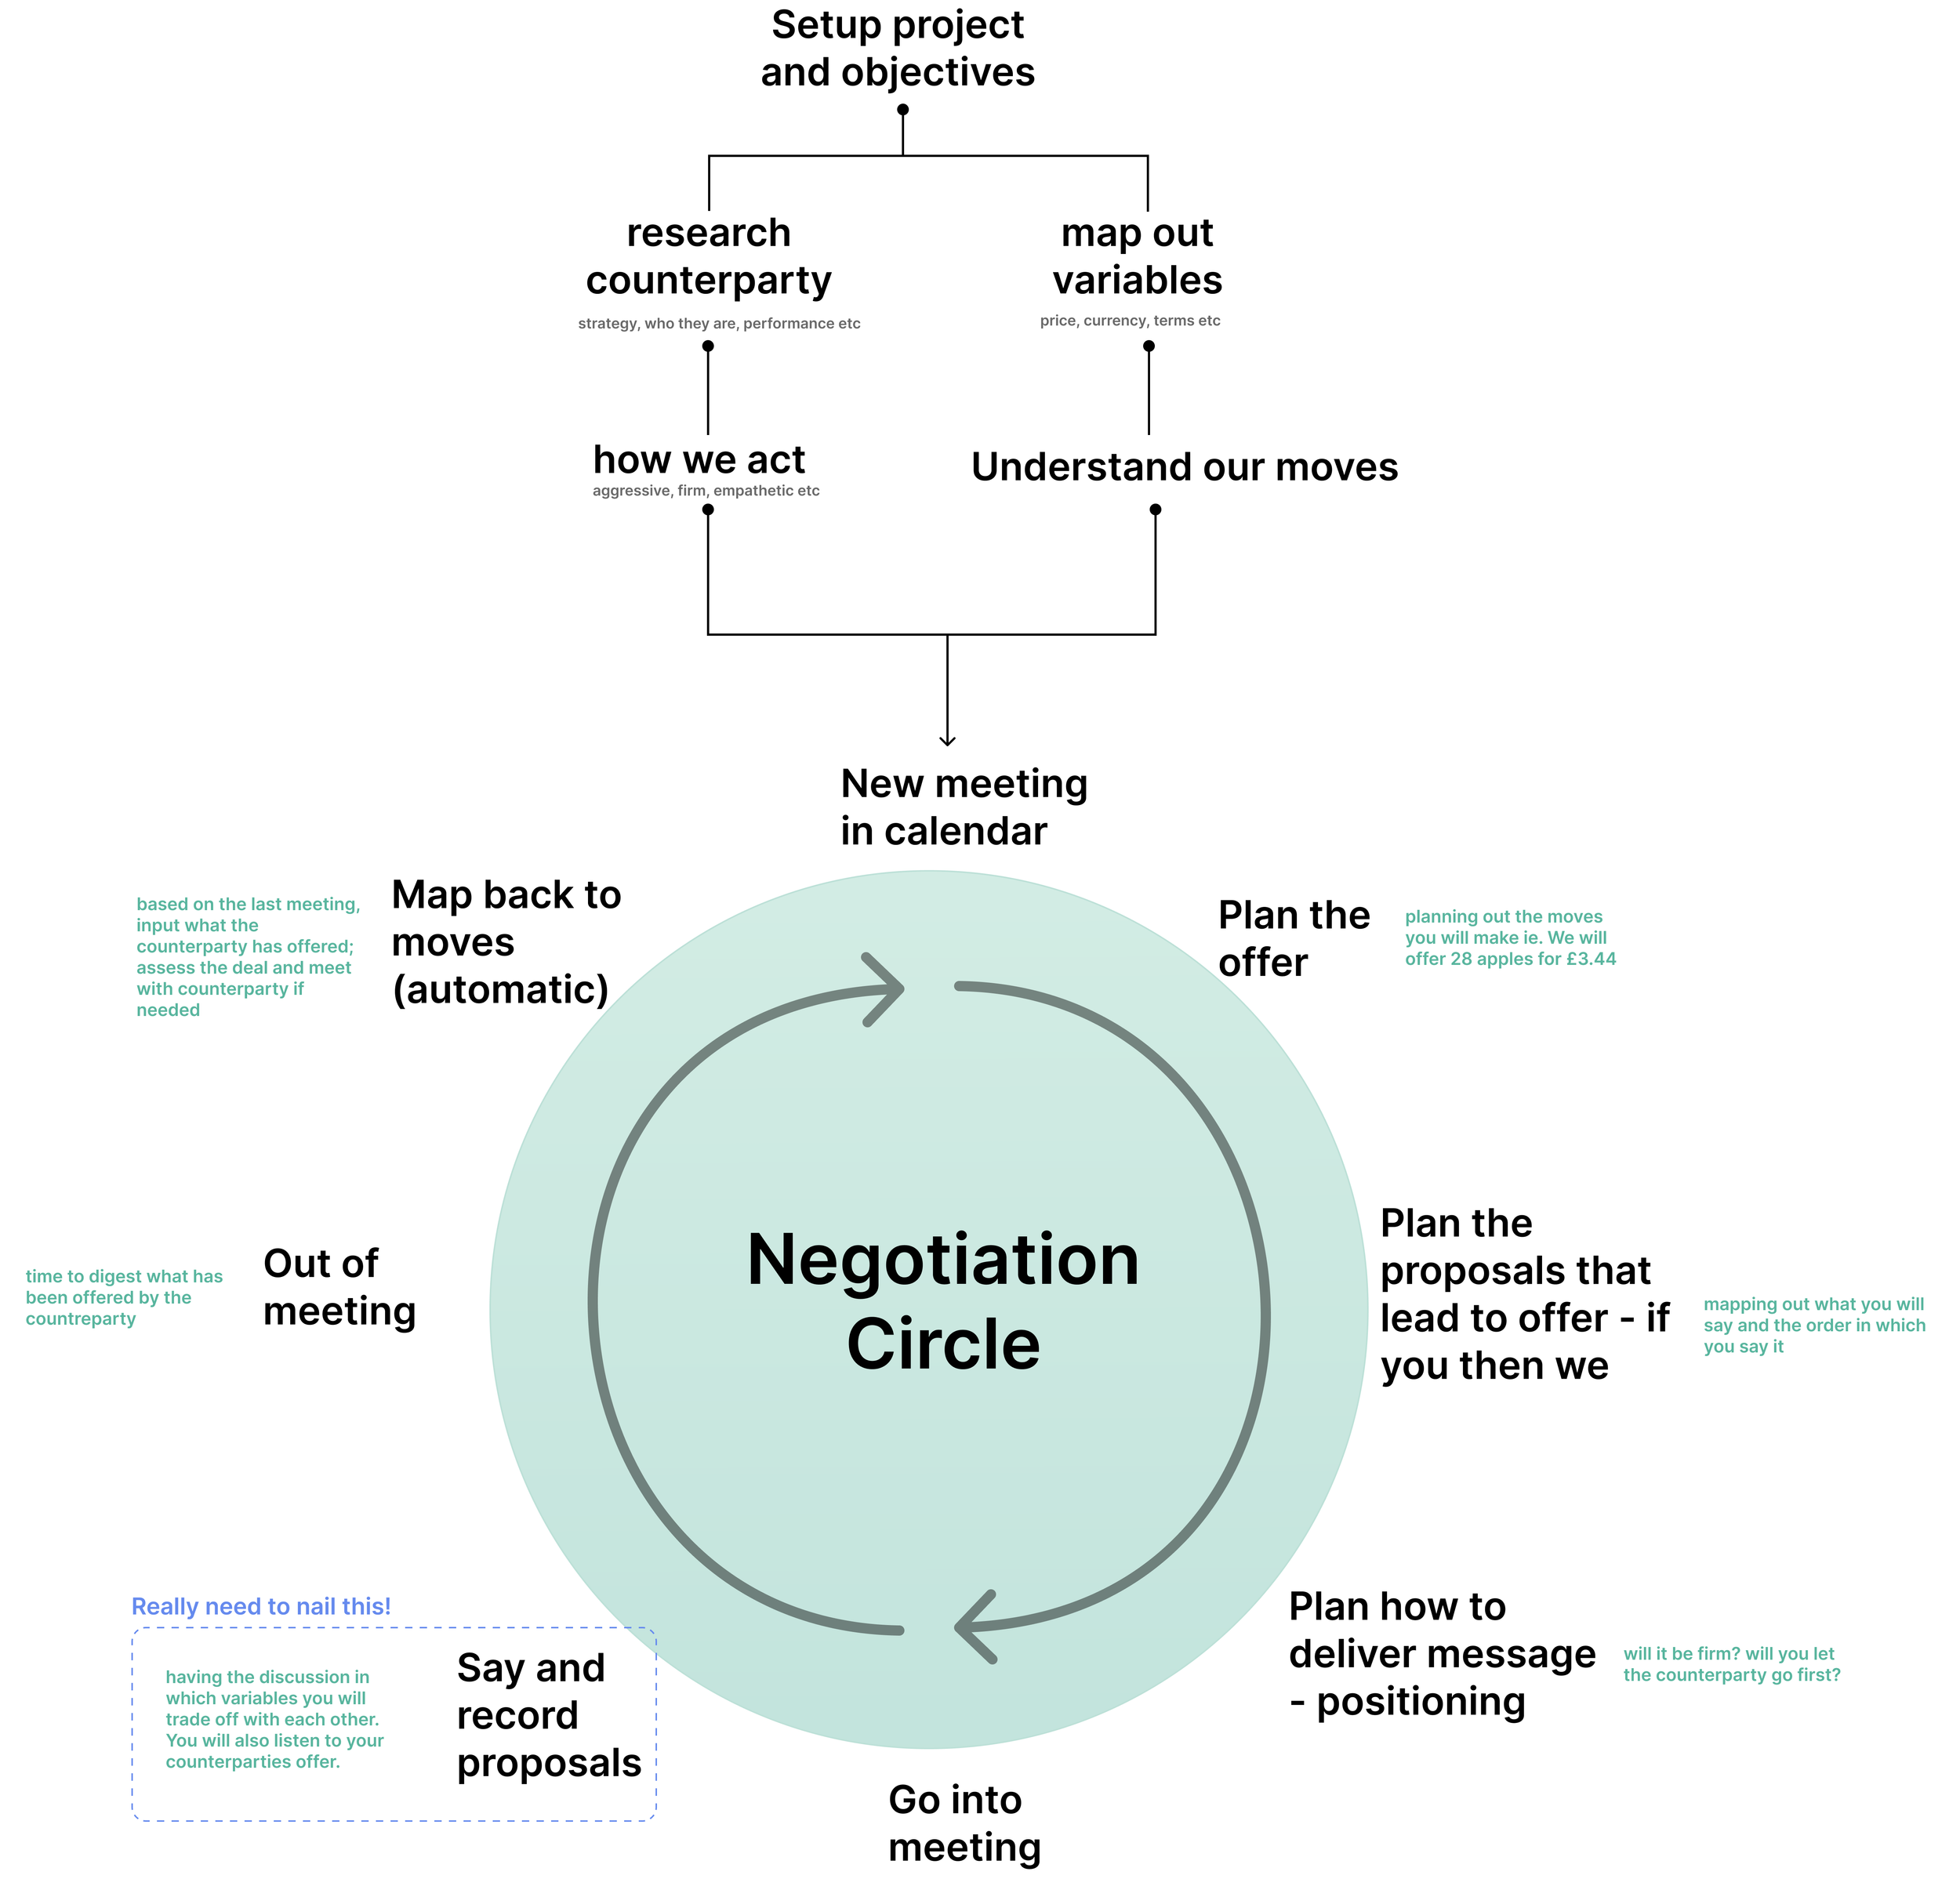
Once the variables are setup the user will spend 70-80% of their time in the negotiation circle.
What is the negotiation circle?
It is where they add numbers to variables, create offers, opening/closing amounts and build out the meeting planner.
Making sure the user can come in anywhere in the circle and pick up where they left off is key to making sure the users come back and continue to interact with the app. The idea behind this circle is to reflect the multiple rounds of offers and proposals the user goes through with their counterparty.
During speaking to users I learnt that this should be easy to use as possible, making it feel like the app is doing the heavy lifting. It was vital to make sure the inputting of data during this part of the app worked under the tense environment. Negotiations are normally done face 2 face without the use of technology, so finding a simple and quick way to enter data was key.
The inception of the whiteboard
This initial concept was an idea that came from pen and paper. When I was on the course learning about negotiations I would note down my thoughts on clusters on a bit of paper. Nothing was in order and it was bit of a brain dump of my planning. I replicated this via a prototype and tweaked it until the concept allowed the user to interact with the tools in how they so wish.
Once we had the green light of this concept we focus our attention to building out the tools. This case study can be read here
Making sure the user is in control
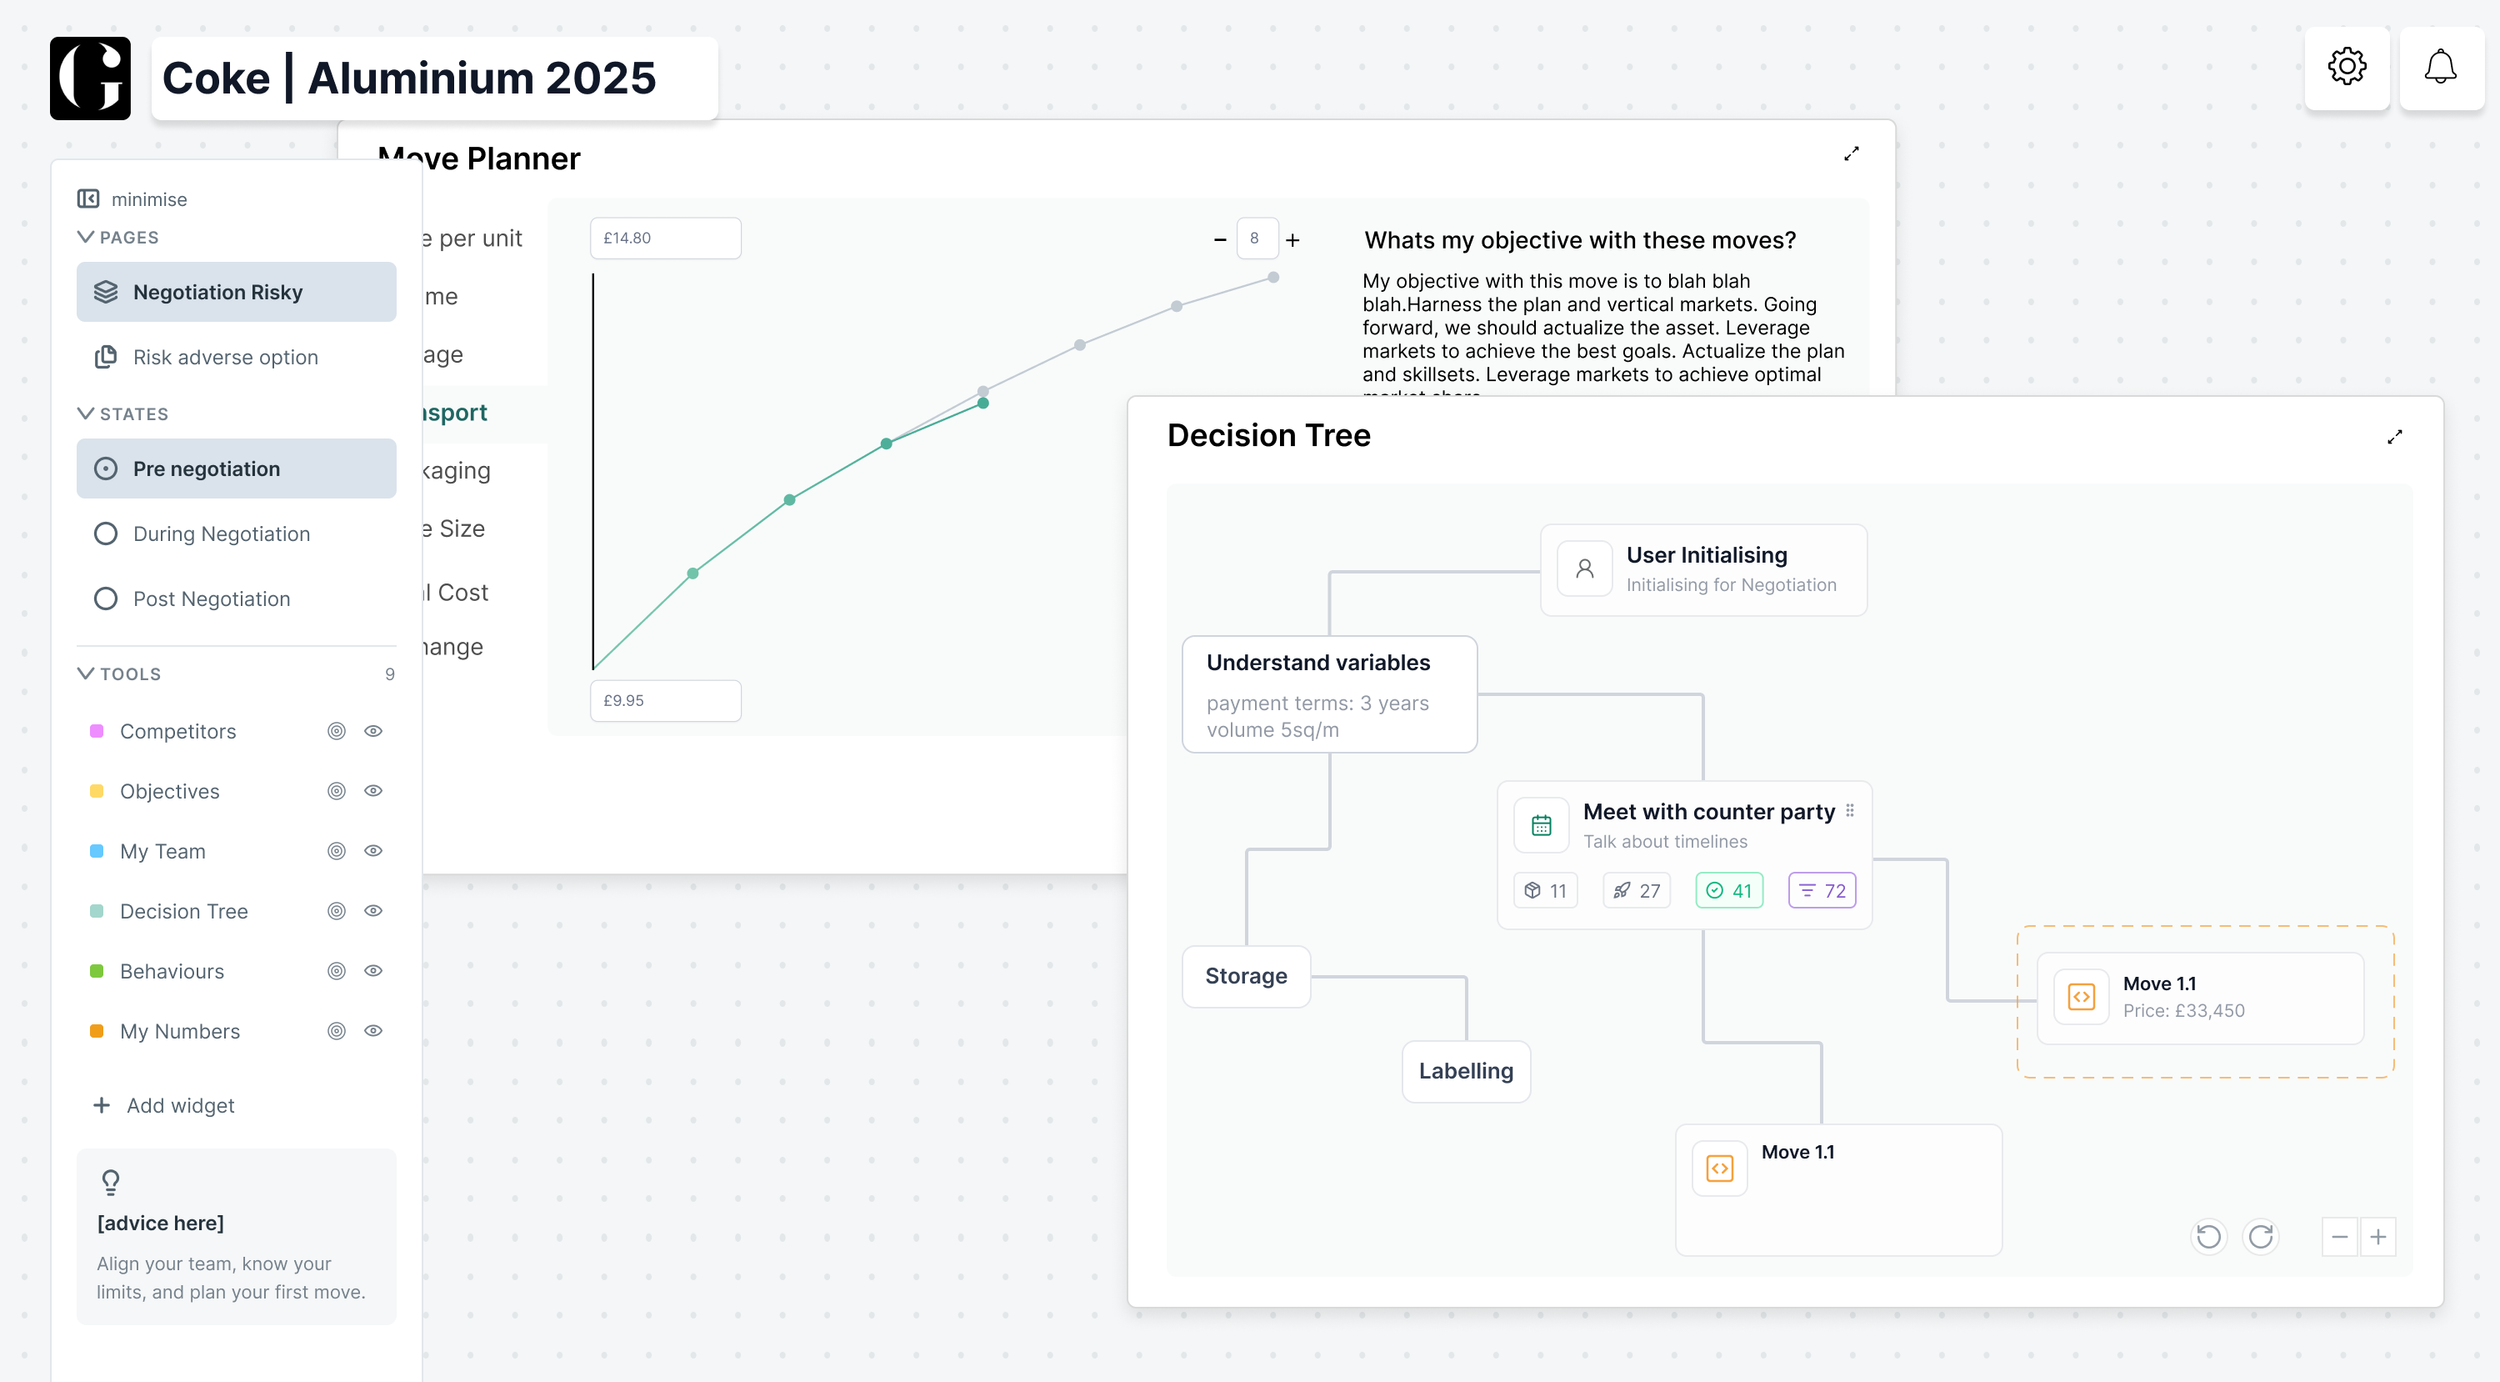
One of the biggest challenges faced is how the user controls the tools and the complexity of the workspace. I ran a workshop then focused our attention to the sidebar. You can see below the first iterations we tested with users.
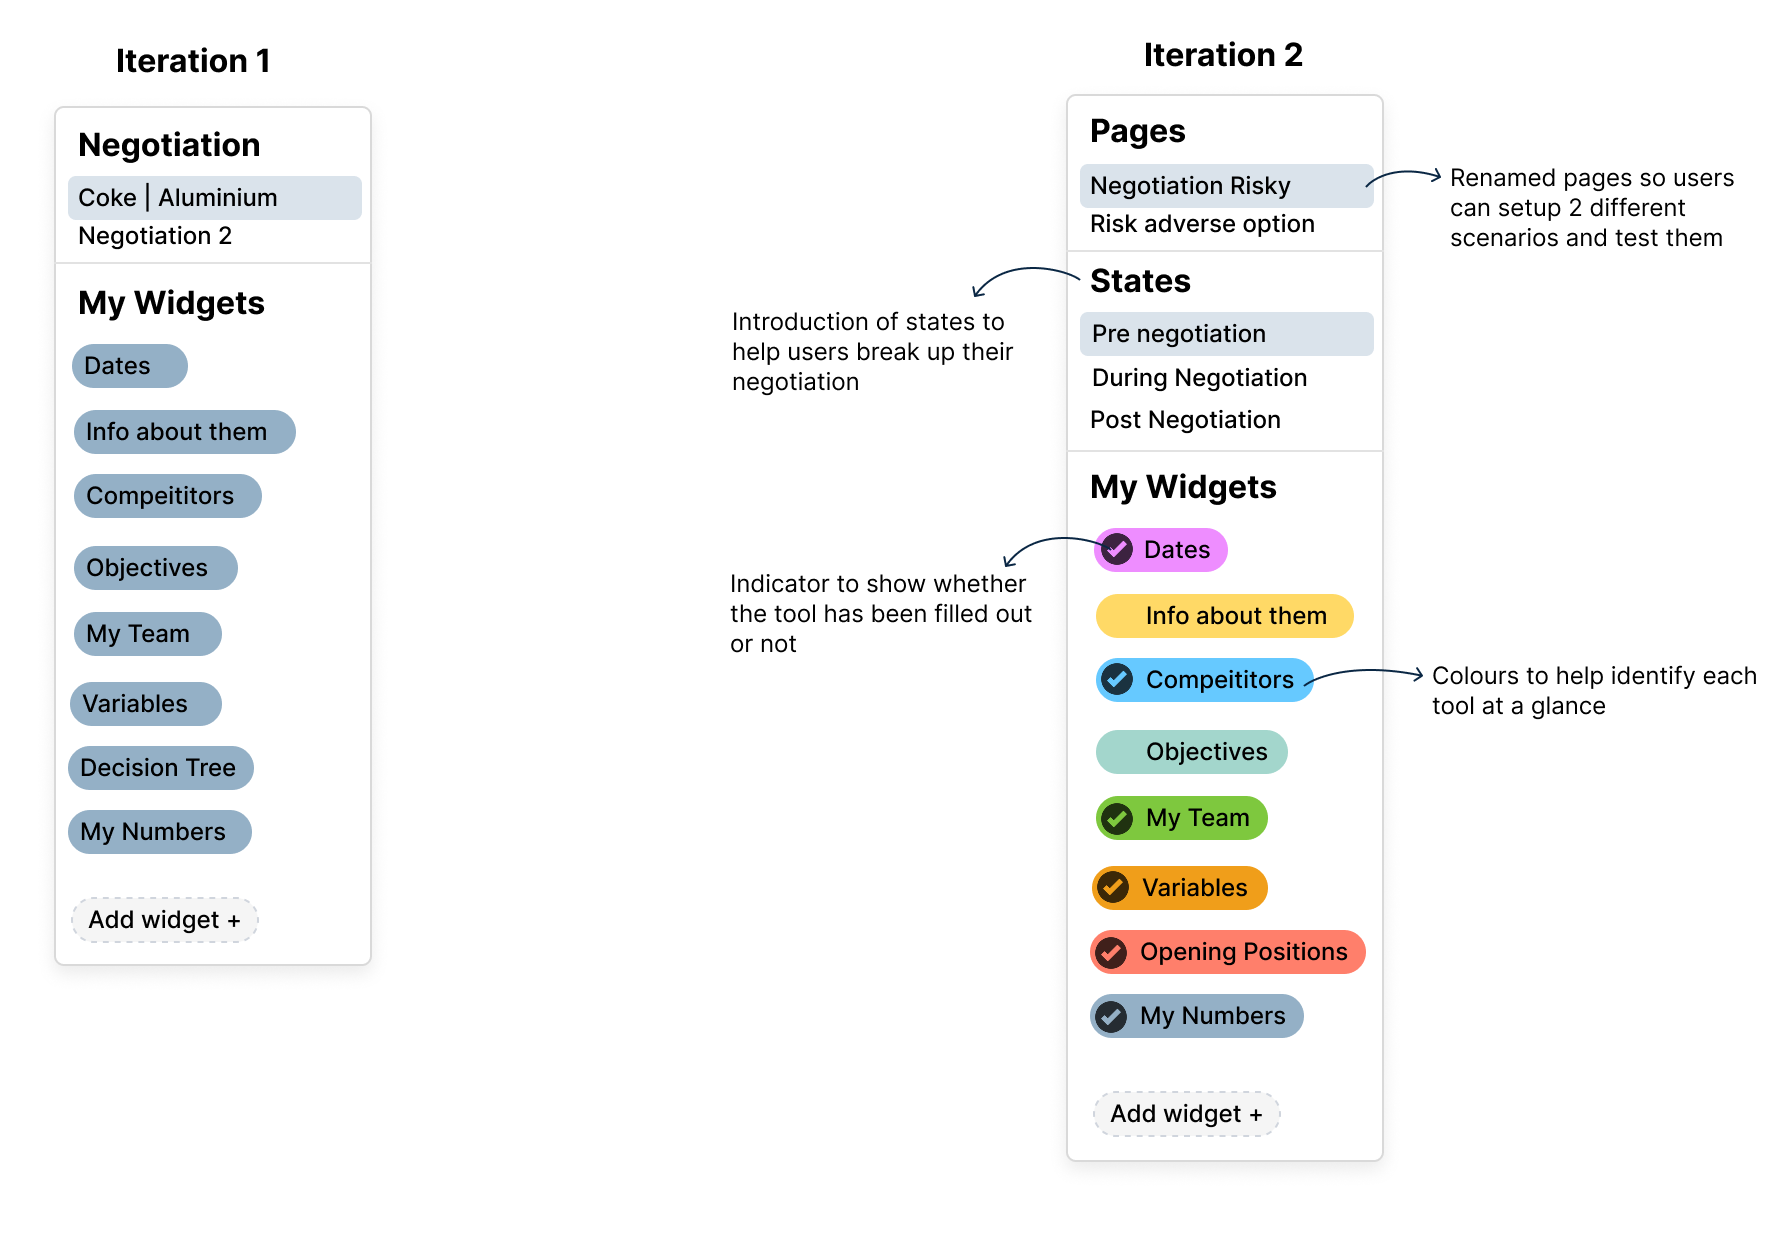
After interaction 2 I cleaned up the UI and turned it into a re-usable component with variables. This allowed for rapid iteration and a more consistent look within it’s environment.
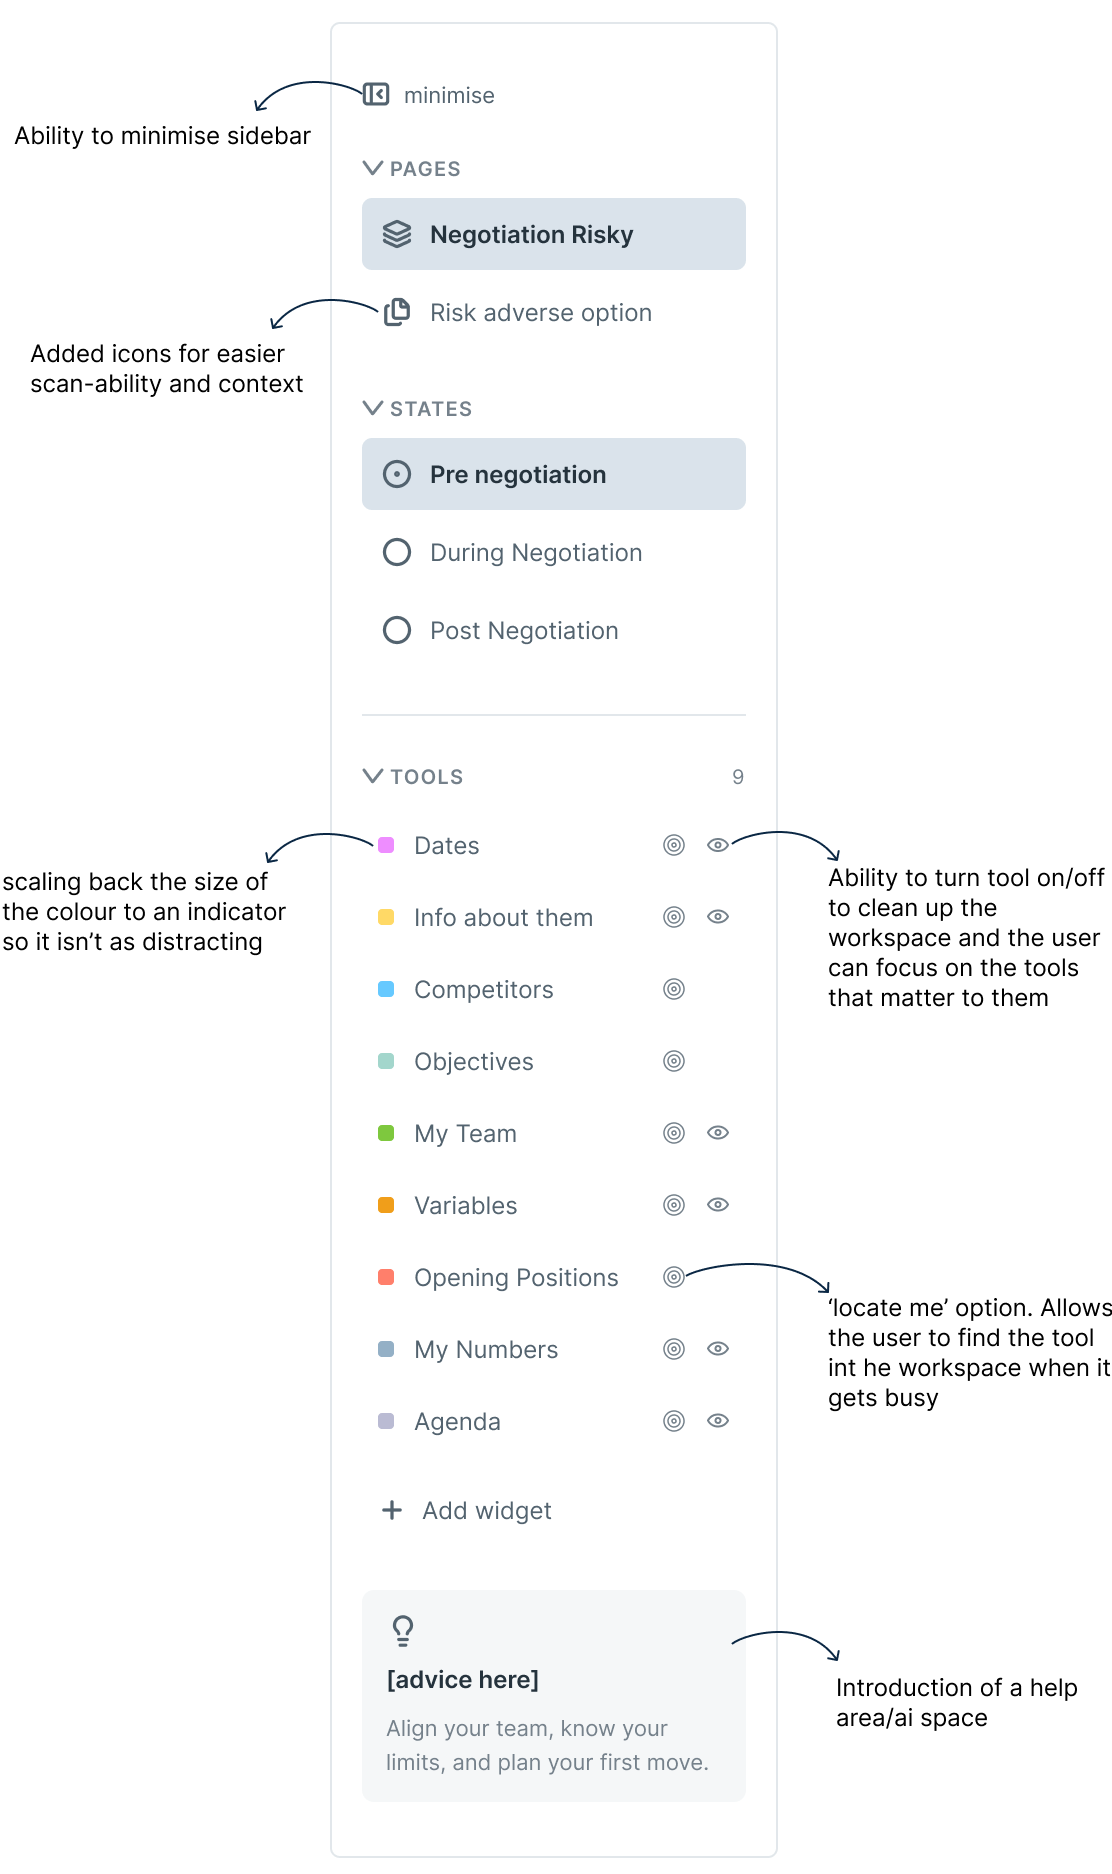
Below you can see the tool controls in action with the user able to ‘hotspot’ a tool of their choosing as well as hide a tool
Example of what the dashboard looks like with the built out tools
Outcome
A fully functional and scalable workspace
Ready to be shipped Q3 of 2026 with the ability to host 9 out of the 11 tools

Updating the tools
Other challenges faced

DISCOVERY & RESEARCH
Integrating AI
DISCOVERY & DESIGN